Christopher Heelan, Jihun Lee , Ronan O’Shea, Laurie Lynch, David M. Brandman,
Wilson Truccolo & Arto V. Nurmikko
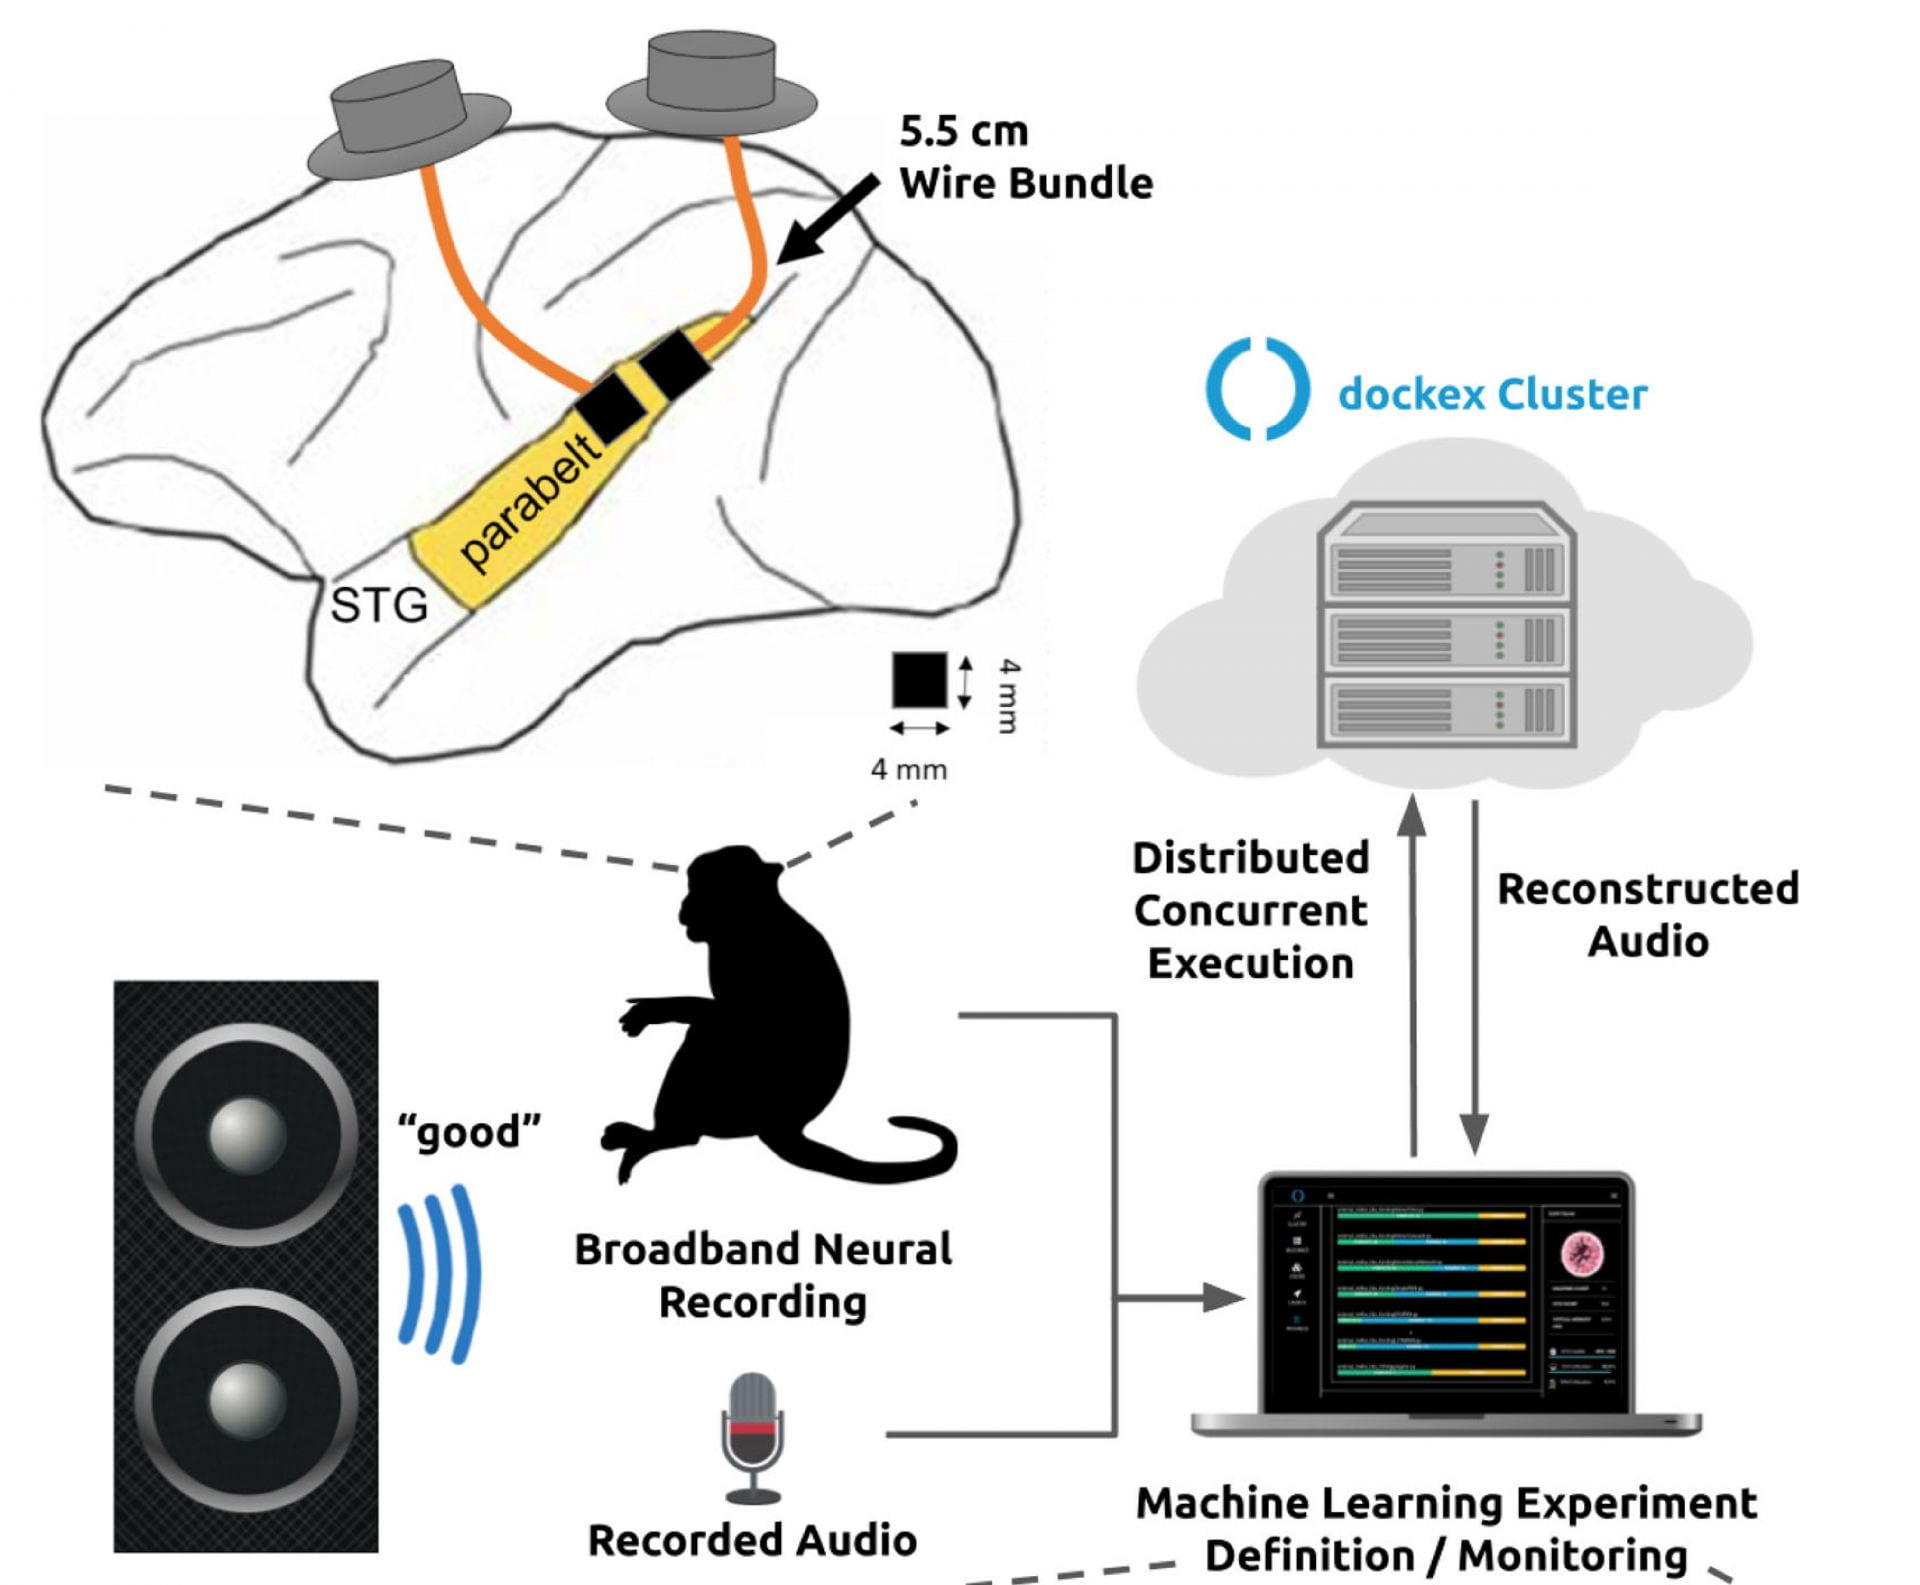
Direct electronic communication with sensory areas of the neocortex is a challenging ambition for brain-computer interfaces. Here, we report the first successful neural decoding of English words with high intelligibility from intracortical spike-based neural population activity recorded from the secondary auditory cortex of macaques. We acquired 96-channel full-broadband population recordings using intracortical microelectrode arrays in the rostral and caudal parabelt regions of the superior temporal gyrus (STG). We leveraged a new neural processing toolkit to investigate the choice of decoding algorithm, neural preprocessing, audio representation, channel count, and array location on neural decoding performance. (Fig. 1)
The presented spike-based machine learning neural decoding approach may further be useful in informing future encoding strategies to deliver direct auditory percepts to the brain as specific patterns of microstimulation. (Fig. 2)

We evaluated seven different neural decoding algorithms including the Kalman filter, Wiener filter, Wiener cascade, dense neural network (NN), simple recurrent NN (RNN), gated recurrent unit (GRU) RNN, and long short-term memory (LSTM) RNN. Each neural network consisted of a single hidden layer and an output layer. All models were trained on Google Cloud Platform n1-highmem-96 machines with Intel Skylake processors. We calculated a mean Pearson correlation between the target and predicted mel-spectrogram by calculating the correlation coefficient for each spectrogram band and averaging across bands (Fig. 3.)
